
A new era for BHP? Or just a little bit of history repeating?

You have to love a good smile when you see one.
And for those who have watched the face of BHP’s Brandon Craig after just a few months at the helm, it feels like the smiles were contagious. Particularly if you were a shareholder.
Are we entering a new era for BHP or is history repeating?
Darren Wilson, Analyst, Oakleigh Investment Management
Tim Moffatt, Managing Director & Portfolio Manager, Oakleigh
Along with a 27 % jump in underlying Earnings Before Interest, Tax, Depreciation and Amortisation (EBITDA) to $US32.9 billion, the most striking number in BHP’s full-year result was undoubtedly the 83 per cent rise in free cash flow (FCF) to $US9.8 billion.
EBITDA is an important measure of just how much money a business is making from its daily operations, while FCF measures the cash generated after operating and capital expenses.
And it’s the cash flow that got investors purring with the biggest final dividend in the last four years, A$1.39 per share. This final distribution was a 65% increase over last year’s final dividend, and when added to the interim dividend of A$1.04 the total cash dividend for the financial year stands at A$2.43.
Against this backdrop, Craig commented: “What we’re working on now is larger than what we’ve done at any point in our history.”
So, just what precisely is BHP working on?
Chanticleer, in his column in the Australian Financial Review, pondered this question.
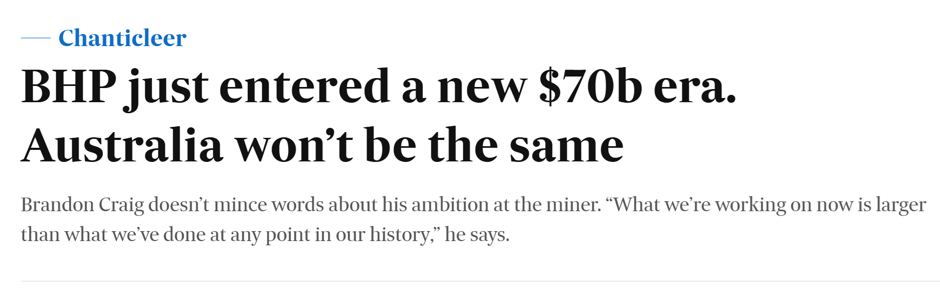
Source - Australian Financial Review: James Thomson, BHP boss Brandon Craig bets $US50b cash flow on copper, 18 August 2026.
“But the sheer scale of the cash that BHP is generating – up to a staggering $US50 billion excluding growth capital expenditure over the next five years, if consensus commodity prices are right – will also allow the company to fund a wave of new copper growth projects around the world, at the same time as a combination of factors – including the data centre boom, the electrification boom, and the decarbonisation boom – are sending copper demand through the roof.”
Some commodity analysts see a structural deficit in copper of around 10 million tonnes a year over the next decade [S&P Global, 8 January 2026].
BHP has a staggering $US44.7 billion in new copper projects they could approve over the next decade, and the message on Tuesday was clear: Craig wants to do as many of these projects as possible, and he wants them started yesterday. With the cash it is generating, almost all could be self-funded.
It all points to a dramatic change in the future direction of one of the world's biggest miners, away from more traditional iron ore mines of Western Australia and more towards the copper-rich area of South America.
However, here is another angle you may not have considered. And it’s this.
When it comes to BHP, we have been here before.
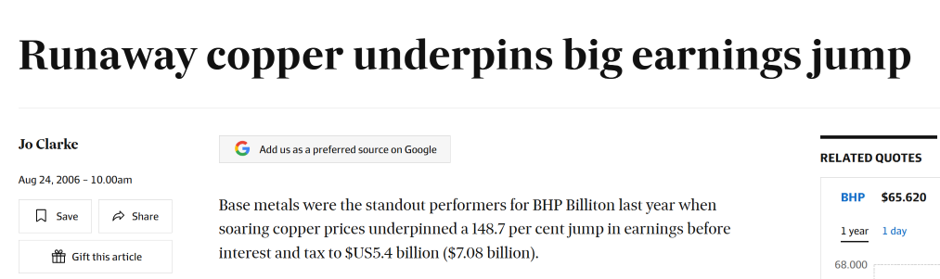
Source: Australian Financial Review, Jo Clarke, ‘Runaway copper underpins big earnings jump’, 24 August 2006.
I know what you’re thinking. Yet another headline about BHP’s recent results. Only, look closer.
You’ll see the date of publication of that article was 24 August 2006.
Both the 2026 and the 2006 articles detailed how copper is the driving force behind record profit upgrades and revenues.
The recent BHP announcement is a reminder of why a little history can go a long way.
When considering future market developments some investors find the 18–20 year Real Estate Cycle a useful lens.
Interestingly, the 2006 article was published at the same phase of the last complete real estate cycle as Craig’s announcement in the current cycle.
Both occurred in the late stage of their respective real estate cycles.
Almost 240 months to the day in fact!
An investment advantage?
History rarely repeats exactly, but it often rhymes. The US has more than 200 years of recorded land prices, giving a long record against which to compare the current cycle.
Rising credit, renewed infrastructure spending and stronger resource demand are all evident, and copper is reclaiming centre stage once again.
For those who study the real estate cycle, such headlines act like alarms to alert you to just what ‘time’ it is.
One recurring marker of the late stages of a cycle has been rising copper prices in the final stages of the cycle.
2026 marks the 14th year of rising land prices in the US.
Many other economies appear to be at a similar stage.
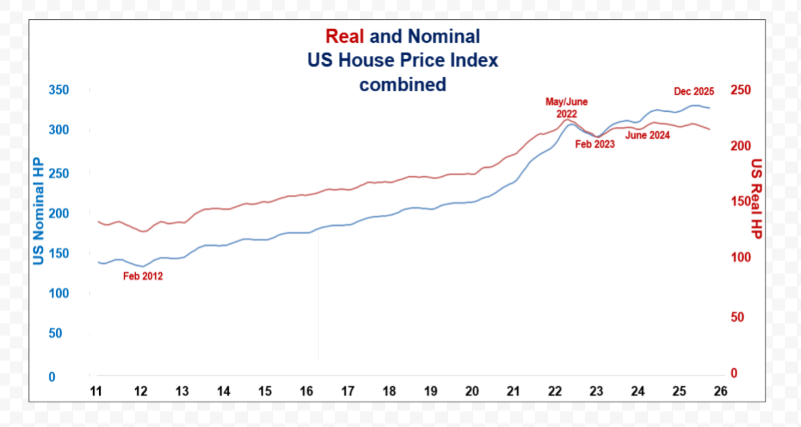
Source: Cathy Stacey, Property Sharemarket Economics
Understanding where we may be in the cycle is one tool investors can use when assessing markets.
And while copper has been an important commodity involved in the construction of residential homes for many years now (thus its price being influenced by housing activity demand), the digitisation of the world has only accelerated its importance, with data centres, electrification and decarbonisation all adding to demand for the metal.
Should history repeat, one possibility is a stalling, then a retrace, of land prices as the US economy turns towards recession.
Oakleigh Investment Management uses its understanding of the real estate cycle to inform portfolio positioning, based on what past cycles suggest may happen. In this case, past cycles suggest that strong copper prices tend to coincide with the closing years of a cycle.
Between 2024 and 2026, investment portfolios managed by Oakleigh Investment Management have had exposure to copper to varying degrees. At times, the 18.6 Strategic Investment Portfolio has held significant positions in select copper stocks and ETFs.
Why? Back in 2005, at the equivalent point of the last completed real estate cycle, copper prices were at or near record highs, and companies with the greatest copper exposure performed strongly relative to the wider market.
It is worth noting that the BHP share price continued to rally from mid-2006 into late 2007, before falling sharply during the GFC. Whether the current bullish trend extends further is genuinely uncertain, and we make no prediction. However, being in the late stage of the cycle means that, alongside participating in rising copper prices, investors may also wish to consider when it may be appropriate to reduce these exposures.
So, the next time you hear or read headlines concerning record-breaking commodity prices, take a moment to go back in history 18 to 20 years and see if you’ve just uncovered another historical repeat.
Here are some other historical parallels we are thinking about currently:
The significant growth in higher yielding investment instruments provided by non-bank lenders (aka private credit) in recent years, compared with the significant growth in higher risk mortgage lending practices globally between 2003 and 2007.
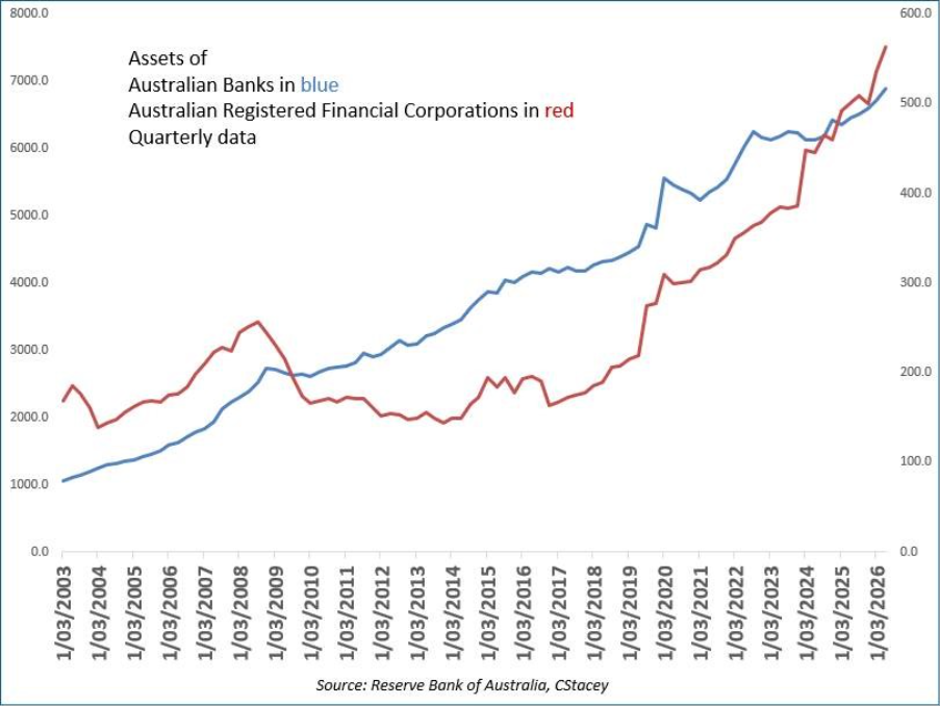
Source: Cathy Stacey, Property Sharemarket Economics
The emergence of private credit losses and fund ‘lockups’ reported during 2026 alongside — though not necessarily analogous to — the early GFC red flags of 2007 when HSBC (Feb 2007) and other market participants (June-Aug 2007) started to highlight the extent of massive losses on their high-risk (“subprime”) lending investments.
The current upward trajectory of government bond yields compared with the mid-2000s, late 1980s, or prior to the 1974 share market crash.

References:
Financial Review: BHP boss Brandon Craig bets $US50b cash flow on copper
S&P Global: Copper in the Age of AI: Challenges of Electrification, Report by S&P Global Energy & Market Intelligence.
Financial Review: Runaway copper underpins big earnings jump
This note is issued by Oakleigh Investment Management Pty Ltd ABN 59 640 392 516, Authorised Representative 1285 526 of Oakleigh Financial Services Pty Ltd AFSL 501454.
The above information are general thoughts only. It is not intended to be nor should it be taken to be financial advice. Because of that, before you make any financial decision, you need to have regard to your personal circumstances and also consider seeking professional advice.
This note contains general information only and is not intended to provide any person with financial advice. It does not take into account any person’s investment objectives, financial situation or needs. You should consider your personal situation and seek professional advice before making any financial decisions.
The note reflects Oakleigh Investment Management’s views and beliefs at the time of preparation which are subject to change without notice. The information is provided in good faith. No representations or warranties are made by Oakleigh Investment Management as to its accuracy and reliability. To the extent permitted by law, no liability is accepted by Oakleigh Investment Management for any loss or damage as a result of any reliance on this information.
Past performance is not a reliable indicator of future performance.
Please refer to full disclosures at www.oakleighfs.com/tcs.